1
2
3
4
5
6
7
8
9
10
11
12
13
14
15
16
17
18
19
20
21
22
23
24
25
26
27
28
29
30
31
32
33
34
35
36
37
38
39
40
41
42
43
44
45
46
47
48
49
50
51
52
53
54
55
56
57
58
59
60
61
62
63
64
65
66
67
68
69
70
71
72
73
74
75
76
77
78
79
80
81
82
83
84
85
86
87
88
89
90
91
92
93
94
95
96
97
98
99
100
101
102
103
104
105
106
107
108
109
110
111
112
113
114
115
116
117
118
119
120
121
122
123
124
125
126
127
128
129
130
131
132
133
134
| import streamlit as st
import pandas as pd
import numpy as np
import matplotlib.pyplot as plt
from scipy.stats import linregress
from scipy.interpolate import interp1d
import tempfile
import shutil
import os
colors = {
"color1": np.array([99, 178, 238]) / 255,
"color2": np.array([118, 218, 145]) / 255,
"color3": np.array([248, 203, 127]) / 255,
"color4": np.array([248, 149, 136]) / 255,
"color5": np.array([124, 214, 207]) / 255,
"color6": np.array([145, 146, 171]) / 255,
"color7": np.array([120, 152, 225]) / 255,
"color8": np.array([239, 166, 102]) / 255,
"color9": np.array([237, 221, 134]) / 255,
"color10": np.array([153, 135, 206]) / 255
}
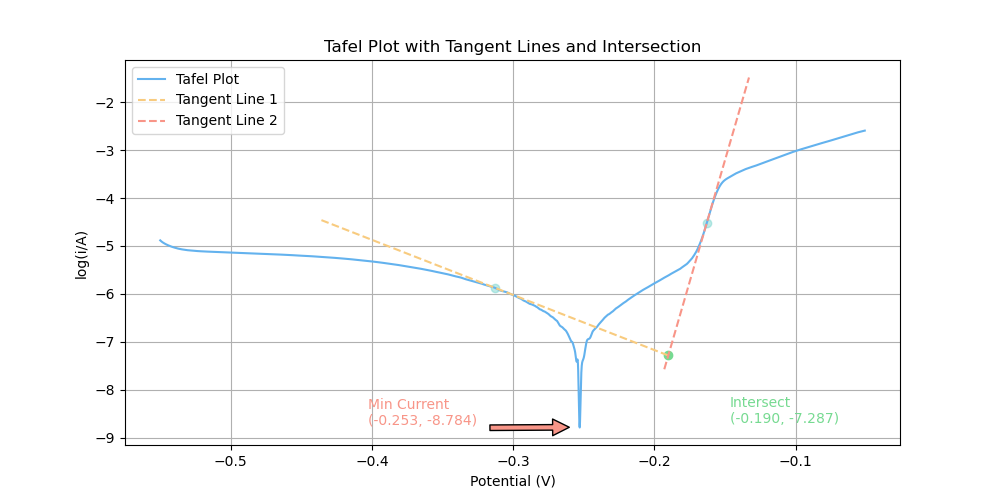
def plot_tafel(data, A_1, A_2):
data['abs_Current/A'] = np.abs(data['Current/A'])
min_current_row = data.loc[data['abs_Current/A'].idxmin()]
mask = (data['Potential/V'] >= min_current_row['Potential/V'] - A_1) & (data['Potential/V'] <= min_current_row['Potential/V'] + A_2)
range_data = data[mask]
point1 = range_data.loc[range_data['Potential/V'].idxmin()]
point2 = range_data.loc[range_data['Potential/V'].idxmax()]
def calculate_tangent_line(data, center_index):
subset = data.loc[center_index-1:center_index+1]
slope, intercept, _, _, _ = linregress(subset['Potential/V'], subset['log(i/A)'])
return slope, intercept
slope1, intercept1 = calculate_tangent_line(data, point1.name)
slope2, intercept2 = calculate_tangent_line(data, point2.name)
x_intersect = (intercept2 - intercept1) / (slope1 - slope2)
y_intersect = slope1 * x_intersect + intercept1
distance_1 = x_intersect - point1['Potential/V']
distance_2 = x_intersect - point2['Potential/V']
interp_function = interp1d(data['Potential/V'], data['log(i/A)'], kind='cubic')
potential_interpolated = np.linspace(data['Potential/V'].min(), data['Potential/V'].max(), 1000000)
current_interpolated = interp_function(potential_interpolated)
plt.figure(figsize=(10, 5))
plt.plot(potential_interpolated, current_interpolated, label='Tafel Plot', color=colors["color1"])
plt.annotate(f'Min Current\n({min_current_row["Potential/V"]:.3f}, {min_current_row["log(i/A)"]:.3f})',
xy=(min_current_row['Potential/V'], min_current_row['log(i/A)']),
xytext=(min_current_row['Potential/V']-0.15, min_current_row['log(i/A)']+0.05),
arrowprops=dict(facecolor=colors["color4"], shrink=0.1),
color=colors["color4"])
plt.scatter(x_intersect, y_intersect, color=colors["color2"])
mm=0.03
x_values_1 = np.linspace(point1['Potential/V'] - max(abs(distance_1),mm), point1['Potential/V'] + max(abs(distance_1),mm), 1000)
y_values_1 = slope1 * x_values_1 + intercept1
x_values_2 = np.linspace(point2['Potential/V'] - max(abs(distance_2),mm), point2['Potential/V'] + max(abs(distance_2),mm), 1000)
y_values_2 = slope2 * x_values_2 + intercept2
plt.plot(x_values_1, y_values_1, label='Tangent Line 1', linestyle='--', color=colors["color3"])
plt.plot(x_values_2, y_values_2, label='Tangent Line 2', linestyle='--', color=colors["color4"])
plt.scatter([point1['Potential/V'], point2['Potential/V']], [point1['log(i/A)'], point2['log(i/A)']], color=colors["color5"], alpha=0.5)
plt.text(0.78, 0.05, f'Intersect\n({x_intersect:.3f}, {y_intersect:.3f})', color=colors["color2"], ha='left', va='bottom', transform=plt.gca().transAxes)
plt.title('Tafel Plot with Tangent Lines and Intersection')
plt.xlabel('Potential (V)')
plt.ylabel('log(i/A)')
plt.legend(loc='upper left')
plt.grid(True)
st.pyplot(plt)
st.title("Tafel Plot Analysis")
uploaded_file = st.file_uploader("Choose a CSV file", type="csv")
if uploaded_file is not None:
file_name, _ = os.path.splitext(uploaded_file.name)
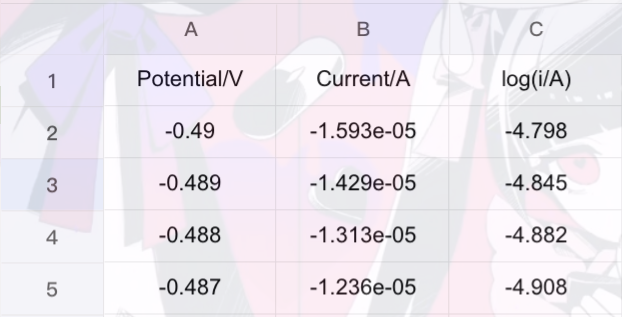
data = pd.read_csv(uploaded_file)
A_1 = st.number_input("输入左切点偏离值", value=0.06)
A_2 = st.number_input("输入右切点偏离值", value=0.06)
plot_button = st.button("Plot Tafel Curve")
if plot_button:
plot_tafel(data, A_1, A_2)
temp_filename = tempfile.mktemp(suffix=".png")
plt.savefig(temp_filename)
st.session_state.temp_filename = temp_filename
if "temp_filename" in st.session_state:
save_button = st.button("Save Plot")
if save_button:
shutil.move(st.session_state.temp_filename, f"{file_name}.png")
st.success("Plot saved successfully!")
del st.session_state.temp_filename
else:
st.write("Please upload a CSV file to proceed.")
|